Ravi Kumar
Registered User.
- Local time
- Today, 15:35
- Joined
- Aug 22, 2019
- Messages
- 162
Okay I didn't know that...Crossposted at https://www.accessforums.net/showthread.php?t=78365&p=439909#post439909
Ravi
Please read this link about crossposting https://www.excelguru.ca/content.php?184
I've deleted your duplicate post
Hi. Is this a duplicate post?
 Did it with another subject today.
Ravi
Not sure why you created another new thread in reports but I tried moving your post here but messed it up. Somehow lost yours whilst moving that of the DB Guy who reported it.
Please can you repeat your last post and uploaded file ...to this thread!
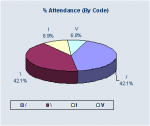
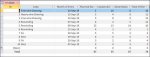
dear sir ,if you can post a db containing those in images in your attachments (1 table, 1 query, 1 report), I will make you a nice report with pie chart (plus extra Cola).
sir , I have attached my database in the thread.No.
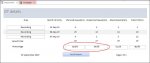
I asked you to post a cut down version of your database or, at the very least, post the sql used for the query which gives the data. Not a screenshot of it.
I also asked you which type of charts you are using.
The data shows number fields. Not text fields.
I am building the report in excel, so the report will
load slow.
hello sir ,
Thank you so much for your help,
but pls clarify my below doubts:
1. Is the data to the graph should be entered manually in excel every time ?
2. I have made a report called "Charts" in my database , can it be changed to pie format(take the data for one date only , as for 2 dates it is not possible)?
4. That is really such a good as well as complex code, can u share any guide related to VBA , so that I can also learn along?
you don't manually enter the data in excel.
I automate the insertion of data.
save the chart as picture and show it in the report.