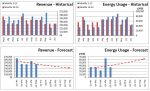
I am trying to create 2 sets of graphs from my database to display in a report. I have 24 months worth of data and I need to create a bar graph that has one series for months 1-12, and a second series for months 13-24. These series should be side by side for each month. Please see the attached image.
My data for each month runs in columns for each customer with the most recent month in the field (MNTH1). So Debit1 to Debit12 would be the first series, and Debit13 to Debit24 will always be the second series. This info gets updated monthly, but the series fields will never change. I already normalized the data and created another query (qryNormalizedByAcct_Rev_Split) to split the months into two fields (each series) but i am having problems writing the query. The report i am using is in qWorkingEachCustQuery which has the graphs.
I will be doing this for the debits (revenue) and energy. If you could help me with one, i should be able to do the other query. Please help!