Same field multiple times

Robertaccessnewb

New member
Local time
Today, 09:40
Joined
Dec 3, 2022
Messages
2
I am really stuck on this one:

I need to display and EDIT the data from this query:

FROM THIS:

NAMEITEMVALUEVALUE_ID
TOM10259,347
TOM102544,940
TOM10253,146
SUE10258,947
SUE102545,040
SUE10252,846


TO THIS:

NAMEITEMVALUE_ID=47VALUE_ID=40VALUE_ID=46
TOM10259,344,93,1
SUE10258,9452,8


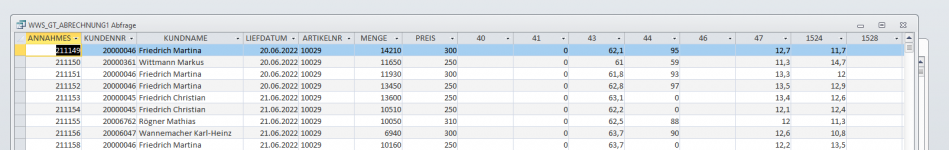
Snapshot of my real rwa Data:


1670089828441.png


This is my Crosstab query, which i cant edit of course:

1670089979778.png


I know when I do a crosstable query i cant change the values.
How can I set up a query or a form to show the valuefields in different columns?

Sorry but i am a newb.
 

Attachments

  • 1670089964997.png
    1670089964997.png
    35 KB · Views: 91
Last edited:
I need to display and EDIT the data from this query:

Even for someone with a few years experience with Access this would be a very difficult task. Picking one of those 2 things is achievable for you, but not both in 1. Just getting the data to display in that manner on a form is a huge undertaking, then adding the ability to edit it doubles its complexity.

Instead, I would just build a form based on the table to edit the data, with each VALUE_ID in its own row. Then if you want to display it as you have shown use the cross-tab query or build a report on it (which is difficult as well).
 
The view of the target representation can be created using a crosstab query. But the order 47, 40, 46 is quite strange because the pivot columns are sorted.

You should update in the original table (via form).

Or you go to Excel. You can do everything in one table. There are plenty of functionalities to work criss-cross.
 
To get the desired output in Access, you can use a combination of a query and a crosstab query.

First, create a query that groups the data by Name, Item, and Value_ID, and calculates the sum of the Value column for each group. This will give you a table with the following columns: Name, Item, Value_ID, and SumOfValue. Now Name and Value are reserved, so be wary of that.

Then just save this query:
Code:
SELECT
    Name,
    Item,
    Value_ID,
    SUM(Value) AS SumOfValue
FROM yourTable
GROUP BY Name, Item, Value_ID;

Next, create a crosstab query based on the previous query. In the crosstab query, use Name and Item as the row headings, and Value_ID as the column heading. This will pivot the data so that the Value_ID values become the column headers, and the corresponding SumOfValue values will be displayed in the cells under each Value_ID column.

Here is an example of what the crosstab query might look like:
Code:
TRANSFORM
    SUM(SumOfValue) AS SumOfValue
SELECT
    Name,
    Item
FROM yourQuery
GROUP BY Name, Item
PIVOT Value_ID;

You'll get the desired output, here's a sample attached as well.
 

Attachments

Here's a sample I made years ago when a client wanted to create a forecasting application and have the data entry look like it did when he was working with Excel. My solution is what I call a "bound denormalized form". It looks like a crosstab but it is updateable. I've included two samples. One that pivots expense types and one that pivots months. The months pivot is easy to justify and since it isn't likely we will change the number of months in a year any time soon, pretty safe to implement. In theory you could do the same thing for days in a month. Although the expences works fine, you could run into trouble if you nad more than about 20 or so expense types. So, always know your dataset before attempting to use this technique.

 
you will need to Save the crosstab to some Dummy table (on my case dummyT).
then you can edit the record from dummyT and on the BeforeUpdate of the form
update the Base table (yourTable).

see Form1 (and dsData) form and the code in it.
 

Attachments

Last edited:
Here's a sample I made years ago when a client wanted to create a forecasting application and have the data entry look like it did when he was working with Excel. My solution is what I call a "bound denormalized form". It looks like a crosstab but it is updateable. I've included two samples. One that pivots expense types and one that pivots months. The months pivot is easy to justify and since it isn't likely we will change the number of months in a year any time soon, pretty safe to implement. In theory you could do the same thing for days in a month. Although the expences works fine, you could run into trouble if you nad more than about 20 or so expense types. So, always know your dataset before attempting to use this technique.


THANK YOU! Your sample Database guided me to the solution!

The trick is to make a query of a Table and join the other queries.

I should have asked much earlier, I always try to figure out on my own and lose weeks of my life :-(
Thank you again.
 
I'm glad you understood the solution. Not everyone does:) Good luck. Just keep in mind that this is probably a limited use solution so don't go promising anything bigger than an annual forecast or maybe 10 year history until you see where the solution bogs down.

One of my students is using the report solution to show history. He has 10, 15, 20 year options but because he didn't want to write the code to spread out the columns, or to just use the 20 year version, he made three versions of the report so the columns would be nicely spaced.
 

Users who are viewing this thread

Back
Top Bottom