view multiple graphs at the same time

sammers101

Registered User.
Local time
Today, 06:34
Joined
May 11, 2012
Messages
89
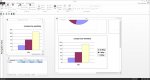
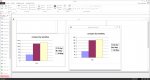
I am trying to combine multiple graphs (about 4) together into one blank report. I have just dragged and dropped a couple of reports into it, it seems to work ok at first, but the last graph is showing up with incorrect data, almost as if I just need to refresh.

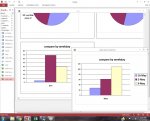
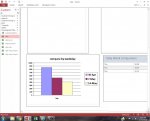
I've tried closing, reopening etc. and even using a form instead. When I rearranged the order in which the reports appear, the last one that was showing incorrect data shows correctly, and instead whichever graph is last on the page is now incorrect.

I also considered using excel to make my graphs and link them to access, but they are a little too complicated for excel (I use several filters, queries, etc.)

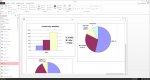
I've attached a sample below, if you open the report "daily", the last graph (daily week comparison) is not right. I have it set to show sales for the current day, but it shows a different day. When I open the graph by itself, it shows up correctly.
 

Attachments

I can't seem to replicate your problem. In the attached Screen Shot.jpg I show the daily report, the daily week comparison report and the row source and they are all consistent. In the attached Screen Shot2.jpg I moved the daily week comparison report to the beginning of the report and it shows the same result.

What are you seeing that's different? You said it was using a different day. What day is that? Also what are your regional settings just in case this is working for me because I'm in the US.
 

Attachments

  • Screen Shot.jpg
    Screen Shot.jpg
    91 KB · Views: 108
  • Screen Shot2.jpg
    Screen Shot2.jpg
    94.1 KB · Views: 90
I am in the US, Eastern Time Zone. I am attaching some screenshots. It shows normally the day before (so today, its showing Sun instead of Mon). And when I move the daily sales graph to the bottom, the numbers are totally wrong and the dates are not even correct.

At first when I tried, it seemed to work like you said. So I changed the date on my desktop to yesterday (5/15), it still was working, then changed it back, and now mysteriously it is back to not working again.
 

Attachments

  • screen1.jpg
    screen1.jpg
    86.7 KB · Views: 106
  • screen2.jpg
    screen2.jpg
    89.5 KB · Views: 147
The charts that you are showing as wrong in your screen shots are what I see when the report is in design view. That means something. I remember hearing something about that on YouTube but I can't remember what it was.

So I'm sorry, but I guess I can't help as I can't replicate the problem. Probably because I'm using Access 2013. What version of Access are you using. Perhaps some other forum member with your version can replicate the problem.

Just one more thing. If you press F9 or whatever Refresh is in your version does it help?
 
It's alright, I am using 2013 also. F9 updates the report, but it is still incorrect when I close it and open it again.

Is there a better way to combine reports? All my graphs use the same query, just different fields, criteria, & filters.
As I said I tried combining them in a form instead but I got the same problem.
 
I don't see anything wrong with the way you are doing this.

This should be necessary but try putting this code in the reports load event as shown.

Code:
Private Sub Report_Load()

Me.daily_by_cat.Requery
Me.daily_by_product.Requery
Me.daily_sales.Requery
Me.daily_week_comparison.Requery


End Sub
 
No change. If I move it higher up it works though. It SEEMS like any report past a certain point (vertically) does weird things.
 
No change. If I move it higher up it works though. It SEEMS like any report past a certain point (vertically) does weird things.

No matter how far down I move them they still work on my system. This is driving me nuts given you have Access 2013 too. What could the difference be? It would be really odd if your Access application broke in this fashion.
 
Not sure. I've uploaded a more complete version, the 2 of the report in the middle of "daily" will be blank, since there are no sales for today, but the bottom one should still be incorrect.

The zip file is complete, the .accdb I had to delete several tables, but it still gives me the same error.

I have also tried it on multiple computers with the same results. I was only able to NOT replicate the problem once. The only thing I can remember doing was changing the time back one day then changing it back. Then I was trying to make a new file, realized a few tables (grouping and tblCategory I believe) were missing which I thought could be making the error magically disappear, but then somewhere around then it started having the error again. But I didn't think the tables had anything to do with it because when I re downloaded what I uploaded here, those tables were not missing.

The main thing I am worried about is being able to trust what these graphs are showing me lol. I only realized it when it was blatant errors, saying it was Monday when it was Tues, and saying I only did $200 in sales today when I did at least $400.
 

Attachments

What about making a shortcut to a report on the desktop? I tried dragging it to the desktop but that opens it in print preview.
 
Still works ok on my system (see attached Screen Shot.jpg). I also had my sister in NY test this and she with Access 2010 also gets the correct results. So this just gets weirder.

I modified the daily report in the attached database taking the charts out of the subreports and putting directly on the report. Please let me know if that makes any difference.
 

Attachments

Nope, still showing wrong date. Thanks for your help, looks like I will need to make smaller report compilations
 
In the attached database I change the Date Grouping in the Report Properties of the daily report and subreports from Use System Settings to US Defaults. The system settings maybe the thing that's different from your computers and mine and my sisters. I also added a daily week comparision rep report which is a report based on the row source of the graph of the daily week comparison report. This report is along side the graph in the daily report. This will tell you if this if just something with charts or whether this problem breaks everything.

Please let me know what the results are. Also please tell me what operating system you are using. I'm using Windows 7 and my sister is using XP.

I don't think you should give up on this problem. You should have to accept this flaw.
 

Attachments

Well the day is still wrong, but this version shows an error when I open the report:
MS Access database engine does not recognize '[4/27]' as a valid field name or expression
This seems to be caused by the report you made "daily week comparison rep", it shows up blank and gives the same error when I open it by itself.

I normally use windows 7 but sometimes windows 8. Right now I am running on win 8, all the other times were windows 7. I will try your file on windows 7 as well.
 
Oops, Seem you can't make a report from crosstab query and expect it to work without some modification of the columns. It worked ok on the day I made it though.

The attached database now has a report that displays the same information as the chart but is based on a regular group by query so it should work this time. Please give it another try.
 

Attachments

A different thread had a problem like yours in that there was nothing wrong with the code. The reports worked on some computers but not others. Basically Access was misbehaving. His solution was updates for Office.

I'd take a look at that possibility. I suggesting making sure both Window and Office are up to date.
 
no more error, but still not working. The screenshot below is win7
 

Attachments

  • screen3.jpg
    screen3.jpg
    84.4 KB · Views: 86
that might be it then because I have not updated office in quite awhile.
 
no more error, but still not working. The screenshot below is win7

But the sub report I put it is showing the correct dates so this tells us that the problem seem to be limited to charts.

I've attached another version which has a command button below the graph which has the following code
Code:
Me.daily_week_comparison.Report!Graph2.Requery

This will requery the graph. Please try it. Note that this is different than what I was doing before in the Report load where I was requerying the subreport. That would do anything as it didn't have a record source.
 

Attachments

Users who are viewing this thread

Back
Top Bottom