Fancy looking age distribution

bbwolff

Registered User.
Local time
Tomorrow, 00:40
Joined
Oct 1, 2013
Messages
116
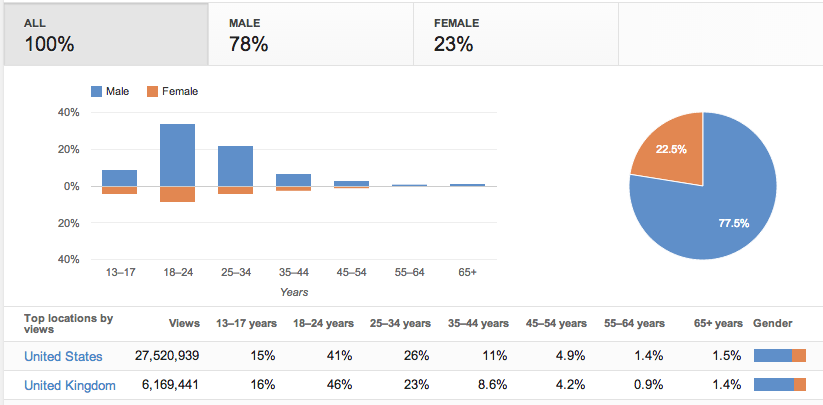
Anyne knows how to make a graph for age distribution?
Something like this

https://support.google.com/youtube/answer/1715072?hl=en

ihav e a query that has all the ppl and their ages in it

SNP_632FA91F8AD1A9DE57BBFB970D0ACD11BCAA_3016473_en_v2
 
Doesn't access have a Chart wizard inside the report wizard?
 
it does, but I'm notgetting far with it.
First question would be how toperform grouping in age groups, either by decade or custom.
 
Like all reports, They run off either a form or a Query.

One way would be adding another column and Giving certain age groups a number (or some kind of factor which makes you recognize the age group)

Another would be the "Group By" clause in the query.

You may also benefit from reading this - I think it has some code which would benefit your problem as it is to do with report age grouping :)

http://www.databasedev.co.uk/report-grouping.html
 
that's great. got my age groups sorted
So i insert graph, set age groups on x axis and count-agegroups on y and... get some default east-west-north grapha about 300 times.

graph1.png
 
Can you post a screenshot showing your problem, I'm not quite sure what you mean :)
 
The video didn't really clarify anything for me bbwolff, What exactly is the problem?
 
I guess it's that i dont know how to add the graph.
I chose graph, chose ag-groups from the query.
Set x-line as age groups, y line as count and get what you saw in video.
i'm sure there's a stupid mistake hidden somewhere, just can't pinpoint it.
 
How to add the Graph to where bbwolff -

You need to make your intentions clear in what you are expecting the graph to show.

Sorry if you are but I'm just not following your intentions here. :(
 
I'm adding a graph to report.
Currently theres's nothing else there as i'm stuck with graph, just the date selector to limit the query.
Query gathers ids, age and age groups.
I want a a simple age distribution graph.
I add graph in design view, select data (age groups from the query) and want to get number in each group as the height of the bar.
You've seen the graph i get and i have no idea where it came from, where the vzhod-zahod ie east-west words came from or where the numbers come from (small table if i double click on the graph).
So all in all I'm kinda lost on a simple task of creating a graph.
 
...
You've seen the graph i get and i have no idea where it came from, where the vzhod-zahod ie east-west words came from or where the numbers come from (small table if i double click on the graph).
So all in all I'm kinda lost on a simple task of creating a graph.
Then afterwards you've to show the report in "Print Preview" or "Report view", to show the graph with your data.
 
hm... now i got the draft
Nothing really happend in reportview, same old graph, but when i went to printpreview i got an error. [Reports]![MonthlyReport]![tdat2] is not recognized and something about ole...

I use tdat1 and tdat2fields on the report to filter the time period in query. If i remove the flter, the graph works.
Will have to look this up, just query filtered normaly with these two values
 

Users who are viewing this thread

Back
Top Bottom