With regard to caching, there was an old study in the IBM Journal of Research and Development back in the days when caching and virtual memory were becoming a "thing" because memory management hardware had crossed an ability threshold. "Back in the days" means late 1950s.
Caching of this type is a precursor to the more modern O/S ability called "virtual demand paging." However, it has similar properties and abilities, just maybe a little clunkier. The question of efficiency depends on some factors that I cannot recall in fine detail, but I can remember enough to have a comment of sorts. Forgive me if I get slightly pedantic on this one. {You may, if you wish, cough at my use of "slightly." I won't be offended.} You might also wish to break out your college-level calculus a little bit.
In essence, caching at any level removes the immediate need to pause what you are doing while the O/S does a disk fetch. If your information is in memory, no disk input is required, and any writeback can be deferred - for a while. Two major factors crop up when analyzing the speed effects.
1. The percent of benefit depends on how much randomness is associated with the pattern of data access. In essence, caching is NEARLY useless in an isolated linear scan of the cached memory. It becomes HIGHLY useful when the pattern of data reference is localized to a small number of records. It also has value when you have several scans of the same data to be performed, one after the other.
2. The amount of memory available for caching reaches a point where adding more memory has limited effect on speed. This is the "law of diminishing returns" as applied to computer memory.
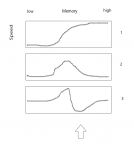
It is all about probability. I'm going to "rough-draw" some relevant graphs to illustrate the point. The graphs represent size of memory cache vs. effect on speed. The experimental results were, basically, "sigmoid" curves where you bop along seeing no particular effect (or a small one at best) until suddenly there is a steep rise in the effect, after which it levels out again. (See chart labeled "1".) Obviously, you get the least effect with the least memory and the best effect with the most memory. In theory, the maximum effect is if you can hold ALL of your data in the cache at once.
Where there is a linear access pattern, imagine grabbing both ends of that chart and stretching it out a bit. The "s-curve" becomes more gradual and shallow. Where there is a highly localized data usage pattern, the opposite occurs and the s becomes steeper because the effect becomes more profound. There is another factor - just how localized we are talking. THAT factor moves the s-curve left or right. The narrower the focus, the farther to the left on that chart. The broader the focus, the more to the right.
The two factors are thus where on the memory chart you see that flex point, and how pronounced it is. "How pronounced" depends on degree of localization of your program's memory reference pattern. I.e. are you 10% more likely or 30% more likely or 50% more likely to touch one certain spot? "Where" depends on how big (or how heavily populated) is your most commonly referenced area. I.e. is there a single "hot spot" or do you have a few "hot spots" or do you have MANY hot spots?
You see this as a clear probability if you take the 1st derivative of chart 1 to get to chart 2 - the familiar Gaussian bell curve. It is hard to put this into words, but in essence chart 2 is a chart of the probability that adding more memory to the cache enabled it to bring in something useful for speed effects. Here, more common statistical terms apply - skew and kurtosis. When you have a small area of interest, skew is to the left. When the different in interest from one area to another is small, your kurtosis flattens the graph.
To find the point at which you have the maximum effect, i.e. when does the "law of diminishing returns" kick in, take the next derivative (see chart 3). The point at which you might as well give up adding more memory is where the arrow is pointing. Again, it is difficult to put that in words because it is now the 2nd derivative of the original graph. It is basically a point at which you are no longer getting enough benefit from adding memory to offset the cost of memory.
Now, the oddity shown in Colin's study in which for some cases, adding memory slowed things down. What happens here is that there is an enemy to caching. It is called "thrashing." (Yeah, they rhyme. No, I didn't make it up. And no, it wasn't my idea. I'm old, but not THAT old...)
Remember I said that with caching you can defer write-back. Windows does that for you. But what happens when you increase the amount of data you keep and start updating things? Eventually you need to write that stuff back because you need to flush the cache to make room for something else. This is most common for linear access cases but also happens - badly - when you DO have multiple hot spots and not quite enough cache to handle them all. In essence, you added another action and changed the access pattern when you get to the point that you have to thrash the cache.
EDIT: Per a later question, in this discussion "adding more memory" is the same in purpose as "increasing cache size."
Hope this helps put things in perspective.
In summary, use caching to greatest effect if you expect a few hot spots among your data set. Don't expect a big difference if everything you do is absolutely linear and flat in access patterns.