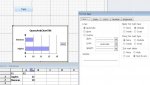
I have been trying unsuccessfully to re-size the boxes which contain data labels in an Access chart. I need the data labels to show value followed by %, separated by comma and space, with all characters side-by-side (not value above or below %). Pre-edit, some of the labels have characters side-by-side but some have them with % below value. When I double click the box which surrounds the label text there seems to be no facility to alter the height or width, only to move it. I would very much appreciate some help with this, if indeed it is possible.