Solved Function to convert percentages into grades (1 Viewer)

Kayleigh

Member
Local time
Today, 01:41
Joined
Sep 24, 2020
Messages
706
Hi there,
I have question which can be answered in Excel/Access - it is calculation, but since I am more familiar with Access VisualBasic I am asking it here. (Actually just stumbled on a very similar forum to this one - MrExcel.com which may prove useful with my Excel dilemmas.)

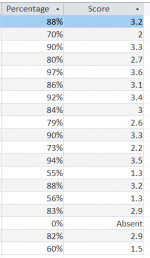
I would like to write a function which converts any given percentage into a grade following the grade system defined (this would vary depending on class so would I define table with this info first?)
I have tried mathematically working this out using ratios/percentages but could not think of a straightforward method to do this...
Would appreciate any ideas.

Sample conversion rates:
0 - 0%
1.0 - 45%
1.6 - 65%
2.3 - 75%
3.1 - 85%
3.7 - 100%
 

theDBguy

I’m here to help
Staff member
Local time
Yesterday, 17:41
Joined
Oct 29, 2018
Messages
21,474
Hi. If I were going to do this in Access, I would use a table and a query instead of a function. Depending on your conversion rules, you may need two values per conversion rate: one for the low end and another for the high end. You can then use a non-equi join in your query to get the grade or percentage. Hope that helps...
 

MajP

You've got your good things, and you've got mine.
Local time
Yesterday, 20:41
Joined
May 21, 2018
Messages
8,529

Kayleigh

Member
Local time
Today, 01:41
Joined
Sep 24, 2020
Messages
706
@theDBguy - I have done a similar idea to what you mention in the past. However the function I am seeking requires:
1. Find point where given percentage lies in table.
2. Calculate the difference between nearest %a and %b.
3. Find the corresponding Grade.
Note the difference between grades varies for each percentage. So I really don't know best way to calculate this...

Link above is in right direction but I think I need to take it further for desired result.
 

theDBguy

I’m here to help
Staff member
Local time
Yesterday, 17:41
Joined
Oct 29, 2018
Messages
21,474
@theDBguy - I have done a similar idea to what you mention in the past. However the function I am seeking requires:
1. Find point where given percentage lies in table.
2. Calculate the difference between nearest %a and %b.
3. Find the corresponding Grade.
Note the difference between grades varies for each percentage. So I really don't know best way to calculate this...

Link above is in right direction but I think I need to take it further for desired result.
Hi. Until we can see an actual example, I can't say it's not possible just using queries. However, a function can certainly do almost anything.
 

Kayleigh

Member
Local time
Today, 01:41
Joined
Sep 24, 2020
Messages
706
I am happy to try this as a query but not sure how I to code the calculation...

I've created the tables necessary. See enclosed
 

Attachments

  • 9-1Converter.accdb
    580 KB · Views: 348

Kayleigh

Member
Local time
Today, 01:41
Joined
Sep 24, 2020
Messages
706
I replicated your suggestion above. However my input data is PERCENTAGES which must be converted into the grades using boundaries provided. Query above outputs percentages.

Also - the hardest bit, to find the closest grade based on the percentage at the start and end of the boundary it falls in.
Eg. 55% would be 1.3 - see first post for sample boundaries.

Also how to join the two tables in the query?
 

MajP

You've got your good things, and you've got mine.
Local time
Yesterday, 20:41
Joined
May 21, 2018
Messages
8,529
However my input data is PERCENTAGES which must be converted into the grades using boundaries provided. Query above outputs percentages.
Does not matter what the output is, the table is is simply lower bound, upperbound, and output. The output could be anything percentage, text, grade. Cat, dog, bird
he hardest bit, to find the closest grade based on the percentage at the start and end of the boundary it falls in
No there is nothing hard about this. It is the exact same formula for every range
>= bottom of range and < top of range
The only issue is the last range where you may need to add a very large number. The start range may be and issue in certain cases because of a hard single value.
 

Kayleigh

Member
Local time
Today, 01:41
Joined
Sep 24, 2020
Messages
706
When referring to query's output it seems to only be possible to provide a value IN THE TABLE.
But I have only entered the boundaries and I would like the query to calculate a value IN BETWEEN those values. It doesn't look like your query will do that??
 

Kayleigh

Member
Local time
Today, 01:41
Joined
Sep 24, 2020
Messages
706
I have written similar queries to the one you provided above. And have used a Dlookup to find nearest value but output is always ONE VALUE in table. Here I am trying to calculate from upper and lower boundary limits and output this new value. I guess it can be queried but don't know best way to do calculation...
 

MajP

You've got your good things, and you've got mine.
Local time
Yesterday, 20:41
Joined
May 21, 2018
Messages
8,529
I have written similar queries to the one you provided above. And have used a Dlookup to find nearest value but output is always ONE VALUE in table. Here I am trying to calculate from upper and lower boundary limits and output this new value. I guess it can be queried but don't know best way to do calculation..
Please provide real examples. I do not know why you would provide one example and then say your data is different. I have no idea what you want, but I think I am doing exactly what your saying. I have an upper and lower bound and provide a value based on that. What is not correct?
 

Kayleigh

Member
Local time
Today, 01:41
Joined
Sep 24, 2020
Messages
706
I apologise for my lack of clarification.
Really appreciate your help here...I can see that this discussion is helping me understand my problem better!
So in summary:
Range of boundaries is:
0 - 0%
1.0 - 45%
1.6 - 65%
2.3 - 75%
3.1 - 85%
3.7 - 100%

Sample data:Output
33%0.7
48%1.1
71%2.0
87%3.2

Hope you can see that given an input, some sort of calculation is required to find a precise output which is in proportion to the upper and lower limit of the range of boundaries.
I think it is possible to extend the query you have done already to do so.
 

MajP

You've got your good things, and you've got mine.
Local time
Yesterday, 20:41
Joined
May 21, 2018
Messages
8,529
Yeah, that was not clear. So you want to do a simple interpolation between the bounds.

Code:
SELECT tbldata.data,
       ( ( [data] - [rangestart] ) * ( [valueend] - [valuestart] ) ) / (
       [rangeend] - [rangestart] ) + [valuestart] AS Score
FROM   tbldata,
       tblrange
WHERE  (( ( tbldata.data ) >= [rangestart]
          AND ( tbldata.data ) < [rangeend] ));
Query2 Query2
Query2 Query2

DataScore
0.3​
0.67​
0.4​
0.89​
0.5​
1.15​
0.55​
1.30​
0.6​
1.45​
0.65​
1.60​
0.7​
1.95​
0.75​
2.30​
0.8​
2.70​
0.85​
3.10​
0.9​
3.30​
0.95​
3.50​
1​
3.70​
0.33​
0.73​
0.48​
1.09​
0.71​
2.02​
0.87​
3.18​

tblRange tblRange

IDRangeStartRangeEndValueStartValueEnd
2​
0​
0.45​
0​
1​
3​
0.45​
0.65​
1​
1.6​
4​
0.65​
0.75​
1.6​
2.3​
5​
0.75​
0.85​
2.3​
3.1​
7​
0.85​
1.0001​
3.1​
3.7​
 

Kayleigh

Member
Local time
Today, 01:41
Joined
Sep 24, 2020
Messages
706
OMG Can't believe that worked!!
THANKS:D
 

Attachments

  • convertor.png
    convertor.png
    17 KB · Views: 338

Users who are viewing this thread

Top Bottom