AccessAllAreas
Member
- Local time
- Today, 03:40
- Joined
- Jul 20, 2020
- Messages
- 42
Hello to All You Experts out There
By means of assistance I have got from these forums, I have got two major steps closer to finishing my project. Thank you. Here is another issue that I have that must be core functionality for the DB app I am producing. I have tried getting it to work on a report, but was unable. I then turned to a Form, but still no joy. But at least with the form I could produce the pre-specfiifed format required for the form in question (it is based upon a PDF). As I am reporting on entered data, I am as sure as this amateur can be that it is a report that I need. However, I cannot get the report to do what i need it to do. I am not a novice with reports. But this seems to be a level of sophistication that is beyond me right now. Hence, my question to the experts.
I am attaching a picture to show what the format of the report must be, with a little fake data in it. A few things have been removed, but nothing that would cause a solution from being unable to be proposed.
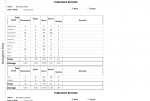
Goal: To be able to report for each "publisher" their monthly "activity", with calculated fields in the bottom two rows. The report would have their personal name at the top, their Date of Birth, their gender and a few other fields relating to personal info. In the grid below, there is a Year field, which would effectively be akin to a financial year (offset from a calendar year). This would autopopulate based upon the calculated field in the query this report would be bound to. Further into the grid, the report should show the activity of the individual per month, going back up to 12 months, a full "fiscal" year. Each of these monthly entries equates to one record in a query. The next record (for the next month, it should show below the previous month). At the bottom of the grid are some totals fields. These should be auto-calculated when the form is run (I am going to try to work that out on my own, but I am definitely not above taking suggestions on the bit too!)
Now, here is the important bit. The grid is duplicated twice on one Letter or A4 page. The personal info mentioned above (Name, Date of Birth, etc) must not be replicated on the same page. If the person has been with the organisation a number of years, it could go onto another page. That page would show the "fiscal" year, starting with the one immediately prior to the one shown on the bottom grid of the First page, continuing in the bottom grid of the second page with previous year to that one, if there was activity from that person with the organisation going back that far. And so forth (although one would normally cut off after going back 48 months).
I have attached two pictures.
Firstly, the form as it should look (with some redactions of personal info). Once again, due to screenshotsize, i only managed to capture the top half of the form as it should look. That means that this picture is just over half of the page, the remaining half is another instance of the grid.
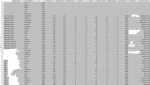
Secondly, a picture of the report output of what I was designing! As you can see, it is horrible. And does not get the data to display correctly, with multiple publisher numbers (different individual's activity) all showing up under the personal name of one Azariah Abraham (not his real name!)
Can anyone help? I am completely stuck!
 publish.png")
 publish.png")
By means of assistance I have got from these forums, I have got two major steps closer to finishing my project. Thank you. Here is another issue that I have that must be core functionality for the DB app I am producing. I have tried getting it to work on a report, but was unable. I then turned to a Form, but still no joy. But at least with the form I could produce the pre-specfiifed format required for the form in question (it is based upon a PDF). As I am reporting on entered data, I am as sure as this amateur can be that it is a report that I need. However, I cannot get the report to do what i need it to do. I am not a novice with reports. But this seems to be a level of sophistication that is beyond me right now. Hence, my question to the experts.
I am attaching a picture to show what the format of the report must be, with a little fake data in it. A few things have been removed, but nothing that would cause a solution from being unable to be proposed.
Goal: To be able to report for each "publisher" their monthly "activity", with calculated fields in the bottom two rows. The report would have their personal name at the top, their Date of Birth, their gender and a few other fields relating to personal info. In the grid below, there is a Year field, which would effectively be akin to a financial year (offset from a calendar year). This would autopopulate based upon the calculated field in the query this report would be bound to. Further into the grid, the report should show the activity of the individual per month, going back up to 12 months, a full "fiscal" year. Each of these monthly entries equates to one record in a query. The next record (for the next month, it should show below the previous month). At the bottom of the grid are some totals fields. These should be auto-calculated when the form is run (I am going to try to work that out on my own, but I am definitely not above taking suggestions on the bit too!)
Now, here is the important bit. The grid is duplicated twice on one Letter or A4 page. The personal info mentioned above (Name, Date of Birth, etc) must not be replicated on the same page. If the person has been with the organisation a number of years, it could go onto another page. That page would show the "fiscal" year, starting with the one immediately prior to the one shown on the bottom grid of the First page, continuing in the bottom grid of the second page with previous year to that one, if there was activity from that person with the organisation going back that far. And so forth (although one would normally cut off after going back 48 months).
I have attached two pictures.
Firstly, the form as it should look (with some redactions of personal info). Once again, due to screenshotsize, i only managed to capture the top half of the form as it should look. That means that this picture is just over half of the page, the remaining half is another instance of the grid.
Secondly, a picture of the report output of what I was designing! As you can see, it is horrible. And does not get the data to display correctly, with multiple publisher numbers (different individual's activity) all showing up under the personal name of one Azariah Abraham (not his real name!)
Can anyone help? I am completely stuck!
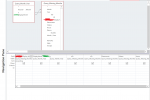
") . That now shows all twelve months in one grid in order (starting September, as needed) even if they do not have actual entries in them!
. That now shows all twelve months in one grid in order (starting September, as needed) even if they do not have actual entries in them!