Venn Diagram in Access...? (1 Viewer)

MSherfey

Registered User.
Local time
Today, 06:49
Joined
Mar 19, 2009
Messages
103
I've been searching on different forums as well as google in general and I can't find any realistic way to make a Venn Diagram. All of the plugins/wizards/ideas make simple overlapping circles.

What I'm doing now is creating an circle in Excel base using the value for what I'm needing as the area of the circle. IE 1000 customers in Market A has an area of 1000 units. I then do this for various needed markets so I can get relative sizes for each market. Now I have to go back by hand and find all the overlapping data and eye-ball that overlap to build the venn. Man, this is a bunch of manual work for something so common!

Does anyone have a more automated way to make Venn Diagrams using Access and/or Excel? If not, I've got an idea for a plugin if someone knows how to write it ;)
 

Banana

split with a cherry atop.
Local time
Today, 03:49
Joined
Sep 1, 2005
Messages
6,318
If it's one of those thing that Excel does better, then I would probably use Excel to report with the diagram by feeding in the needed data from Access and automating Excel.
 

DCrake

Remembered
Local time
Today, 11:49
Joined
Jun 8, 2005
Messages
8,632
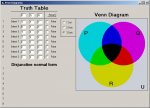
If you have access to VB6 I have a project that may help you.
See image of screen. This is not my project it came from http://www.planetsourcecode.com/
 

MSherfey

Registered User.
Local time
Today, 06:49
Joined
Mar 19, 2009
Messages
103
I'm sorry but I don't see any screenshots. I think that's what you were referring to.

I followed the link bust couldn't find a project which looked like a Venn project.
 

DCrake

Remembered
Local time
Today, 11:49
Joined
Jun 8, 2005
Messages
8,632
Sorry forgot to add the pic

Here it is
 

Attachments

  • Venn.JPG
    Venn.JPG
    44.3 KB · Views: 617

gemma-the-husky

Super Moderator
Staff member
Local time
Today, 11:49
Joined
Sep 12, 2006
Messages
15,692
cant you do this with a pie-chart or something else, or some intrinsic access functionality

i would have thought a venn diagram was non-relational, and therefore something oyu would need to do in code only. as such, it will almost certainly become fairly tricky to do in access.
 

DCrake

Remembered
Local time
Today, 11:49
Joined
Jun 8, 2005
Messages
8,632
Dave,

Don't now what venn diagrams do but I simply found a project dealing with them and passed the info on.

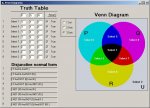
Here is the results of clicking al the options true

David
 

Attachments

  • Venn2.JPG
    Venn2.JPG
    61.5 KB · Views: 361

MSherfey

Registered User.
Local time
Today, 06:49
Joined
Mar 19, 2009
Messages
103
These are pretty good, but I'm looking for something with accuracy. The circles need to be of a size which is relational to each other. If Area A is 50 and Area B is 25 then A needs to be 2x B. Then their 'overlap' needs to be relational too.

So far I'm just using Access to get the values then going to Excel and doing areas by hand and sighting their 'overlap'. It's accurate, relational, looks good, but is way too much work to keep doing. When they come back with a change request I'll pull my hair out. :)
 

gemma-the-husky

Super Moderator
Staff member
Local time
Today, 11:49
Joined
Sep 12, 2006
Messages
15,692
msherfey

surely a venn diagram is NOT intended to be reflect accurate ratios - its just a pictorial representation of a real world position.


dc

venn diagrams are used to illustrate real world set membership, (i think that is a correct description)

ie
50% percent of kids like jelly (jello for you US types)
70% like icecream
10% like neither

a venn diagram draws overlapping circles (topographic shapes? if thats the right word - it doesnt logically HAVE to be a circle) illustrating these relationships, and identifies therefore all possible subsets of the entire population.

ie have one circle for jelly likers, 1 circle for icecream likers - the bit where both circles overlaps indicates kids who like both, and the area outside the circles indicates kids who like neither.

(i think 30% in the above example like both, so we get
ie 10% like neither - given
20% like jelly only - 50-30)
30% like both - caclulated
40 % like icecream only 70 -30)

- but my maths professor said they could not be used to prove any assertion/statement with rigour.

In any event, I think it would be real hard to size and position them to represent the real world proportions.

I mean given 2 circles, 1 of area 50 units, 1 of area of 70 units how would you calculate the centres of each circle so that the overlap represents an area of 30 units (given the jelly/icecream example) which is what the OP is asking.
 

MSherfey

Registered User.
Local time
Today, 06:49
Joined
Mar 19, 2009
Messages
103
Gemma, you're spot-on describing the issue. It's simple to get the areas accurate, but the overlap takes a bit of doing. However, I disagree with your assertion that a VENN shouldn't be used to reflect accurate ratios. That's where the real power of the data comes to life.

Look at the attached fild (pdf). When you put the different psychographic groups in relation to each other and to the whole, it makes a huge difference. (The excel file/powerpoint file show perfect circles but for some reason the conversion to pdf made them very slightly oval)
 

Attachments

  • Copy.zip
    206.6 KB · Views: 249

NigelShaw

Registered User.
Local time
Today, 11:49
Joined
Jan 11, 2008
Messages
1,573
Hi

Here's a thought ( not knowing about what your talking about though!)

If it's just visual, why not create two slightly transparent coloured pngs and place them aligned on the form. Than have them move toward each other depending on the % ratio of the data.


Just a thought


Nigel
 

Users who are viewing this thread

Top Bottom